1 简介
Dot 是 Graphviz 开源图形可视化软件中的六个布局程序之一,由 AT&T 创建。
Graphviz 布局程序采用简单的文本图形描述并以各种格式制作有用的图表。
Dot 代码块默认调用 dot 布局程序,但可以配置为调用任何其他五个 Graphviz 布局程序。
图形可视化在很多技术领域都有应用,它常常用于探索大型数据集。
Org 模式中的典型用法是将点源代码块链接到另一种语言的源代码块,该代码块负责将数据表转换为其中一种 Graphviz 布局语言的源代码。
3 使用示例
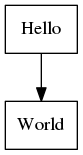
| a | Hello |
| b | World |
(mapcar #'(lambda (x) (princ (format "%s [label =\"%s\", shape = \"box\"];\n" (first x) (second x)))) table) (princ (format "%s -> %s;\n" (first (first table)) (first (second table)))) |
a [label ="Hello", shape = "box"];
b [label ="World", shape = "box"];
a -> b;
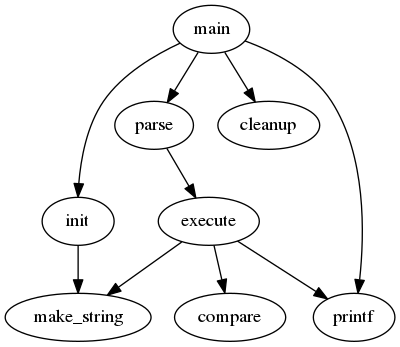
digraph { $input } |
digraph G { main -> parse -> execute; main -> init; main -> cleanup; execute -> make_string; execute -> printf init -> make_string; main -> printf; execute -> compare; } |
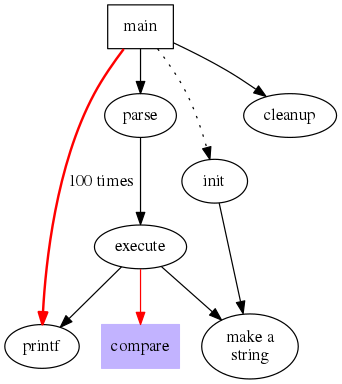
digraph G { size ="4,4"; main [shape=box]; /* this is a comment */ main -> parse [weight=8]; parse -> execute; main -> init [style=dotted]; main -> cleanup; execute -> { make_string; printf} init -> make_string; edge [color=red]; // so is this main -> printf [style=bold,label="100 times"]; make_string [label="make a\nstring"]; node [shape=box,style=filled,color=".7 .3 1.0"]; execute -> compare; } |
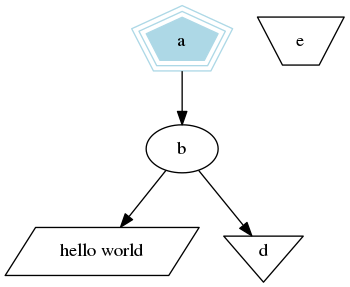
digraph G { a -> b -> c; b -> d; a [shape=polygon,sides=5,peripheries=3,color=lightblue,style=filled]; c [shape=polygon,sides=4,skew=.4,label="hello world"] d [shape=invtriangle]; e [shape=polygon,sides=4,distortion=.7]; } |
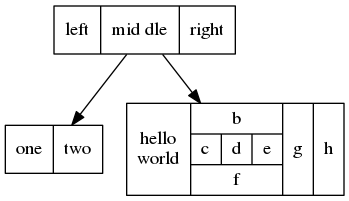
digraph structs { node [shape=record]; struct1 [shape=record,label="<f0> left|<f1> mid\ dle|<f2> right"]; struct2 [shape=record,label="<f0> one|<f1> two"]; struct3 [shape=record,label="hello\nworld |{ b |{c|<here> d|e}| f}| g | h"]; struct1 -> struct2; struct1 -> struct3; } |
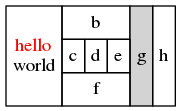
digraph html { abc [shape=none, margin=0, label=< <TABLE BORDER="0" CELLBORDER="1" CELLSPACING="0" CELLPADDING="4"> <TR><TD ROWSPAN="3"><FONT COLOR="red">hello</FONT><BR/>world</TD> <TD COLSPAN="3">b</TD> <TD ROWSPAN="3" BGCOLOR="lightgrey">g</TD> <TD ROWSPAN="3">h</TD> </TR> <TR><TD>c</TD> <TD PORT="here">d</TD> <TD>e</TD> </TR> <TR><TD COLSPAN="3">f</TD> </TR> </TABLE>>]; } |
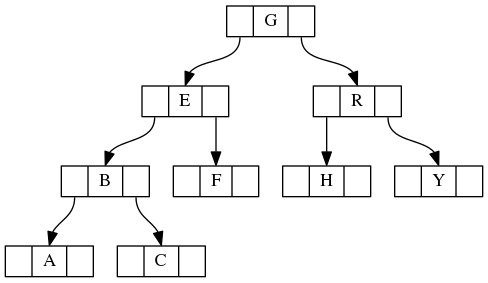
digraph g { node [shape = record,height=.1]; node0[label = "<f0> |<f1> G|<f2> "]; node1[label = "<f0> |<f1> E|<f2> "]; node2[label = "<f0> |<f1> B|<f2> "]; node3[label = "<f0> |<f1> F|<f2> "]; node4[label = "<f0> |<f1> R|<f2> "]; node5[label = "<f0> |<f1> H|<f2> "]; node6[label = "<f0> |<f1> Y|<f2> "]; node7[label = "<f0> |<f1> A|<f2> "]; node8[label = "<f0> |<f1> C|<f2> "]; "node0":f2 -> "node4":f1; "node0":f0 -> "node1":f1; "node1":f0 -> "node2":f1; "node1":f2 -> "node3":f1; "node2":f2 -> "node8":f1; "node2":f0 -> "node7":f1; "node4":f2 -> "node6":f1; "node4":f0 -> "node5":f1; } |
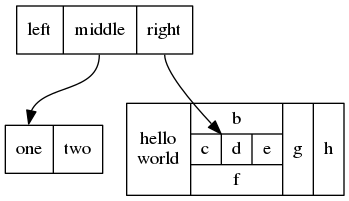
digraph structs { node [shape=record]; struct1 [shape=record,label="<f0> left|<f1> middle|<f2> right"]; struct2 [shape=record,label="<f0> one|<f1> two"]; struct3 [shape=record,label="hello\nworld |{ b |{c|<here> d|e}| f}| g | h"]; struct1:f1 -> struct2:f0; struct1:f2 -> struct3:here; } |
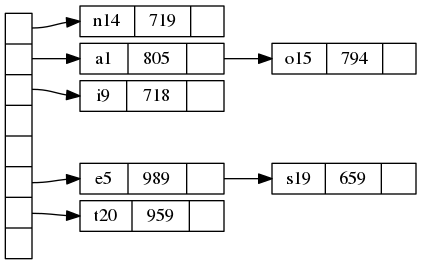
digraph G { nodesep=.05; rankdir=LR; node [shape=record,width=.1,height=.1]; node0 [label = "<f0> |<f1> |<f2> |<f3> |<f4> |<f5> |<f6> | ",height=2.5]; node [width = 1.5]; node1 [label = "{<n> n14 | 719 |<p> }"]; node2 [label = "{<n> a1 | 805 |<p> }"]; node3 [label = "{<n> i9 | 718 |<p> }"]; node4 [label = "{<n> e5 | 989 |<p> }"]; node5 [label = "{<n> t20 | 959 |<p> }"]; node6 [label = "{<n> o15 | 794 |<p> }"]; node7 [label = "{<n> s19 | 659 |<p> }"]; node0:f0 -> node1:n; node0:f1 -> node2:n; node0:f2 -> node3:n; node0:f5 -> node4:n; node0:f6 -> node5:n; node2:p -> node6:n; node4:p -> node7:n; } |
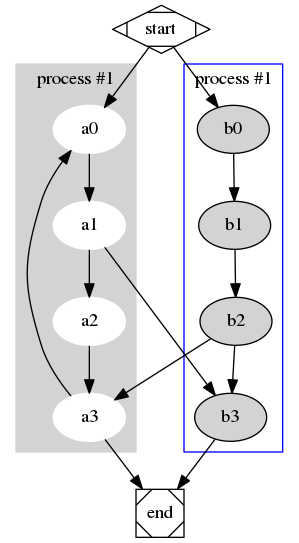
digraph G { subgraph cluster0 { node [style=filled,color=white]; style=filled; color=lightgrey; a0 -> a1 -> a2 ->a3; label = "process #1"; } subgraph cluster1 { node [style=filled]; b0 -> b1 -> b2 ->b3; label = "process #1"; color=blue; } start -> a0; start -> b0; a1 -> b3; b2 -> a3; a3 -> a0; a3 -> end; b3 -> end; start [shape=Mdiamond]; end [shape=Msquare]; } |
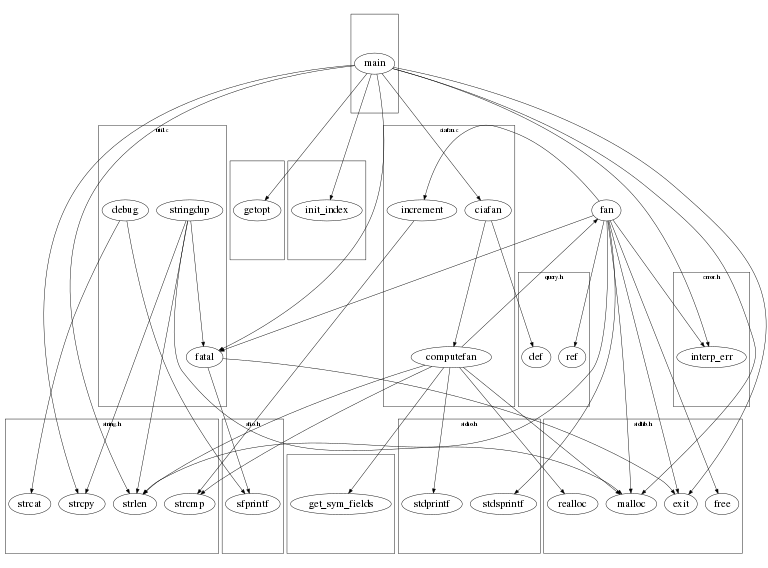
digraph G { size="8,6"; ratio=fill; node[fontsize=24]; ciafan->computefan; fan->increment; computefan->fan; stringdup->fatal; main->exit; main->interp_err; main->ciafan; main->fatal; main->malloc; main->strcpy; main->getopt; main->init_index; main->strlen; fan->fatal; fan->ref; fan->interp_err; ciafan->def; fan->free; computefan->stdprintf; computefan->get_sym_fields; fan->exit; fan->malloc; increment->strcmp; computefan->malloc; fan->stdsprintf; fan->strlen; computefan->strcmp; computefan->realloc; computefan->strlen; debug->sfprintf; debug->strcat; stringdup->malloc; fatal->sfprintf; stringdup->strcpy; stringdup->strlen; fatal->exit; subgraph "cluster_error.h" { label="error.h"; interp_err; } subgraph "cluster_sfio.h" { label="sfio.h"; sfprintf; } subgraph "cluster_ciafan.c" { label="ciafan.c"; ciafan; computefan; increment; } subgraph "cluster_util.c" { label="util.c"; stringdup; fatal; debug; } subgraph "cluster_query.h" { label="query.h"; ref; def; } subgraph "cluster_field.h" { get_sym_fields; } subgraph "cluster_stdio.h" { label="stdio.h"; stdprintf; stdsprintf; } subgraph "cluster_<libc.a>" { getopt; } subgraph "cluster_stdlib.h" { label="stdlib.h"; exit; malloc; free; realloc; } subgraph "cluster_main.c" { main; } subgraph "cluster_index.h" { init_index; } subgraph "cluster_string.h" { label="string.h"; strcpy; strlen; strcmp; strcat; } } |
digraph G { compound = true; subgraph cluster0 { a -> b; a -> c; b -> d; c -> d; } subgraph cluster1 { e -> g; e -> f; } b -> f [lhead=cluster1]; d -> e; c -> g [ltail=cluster0, lhead=cluster1]; c -> e [ltail=cluster0]; d -> h; } |
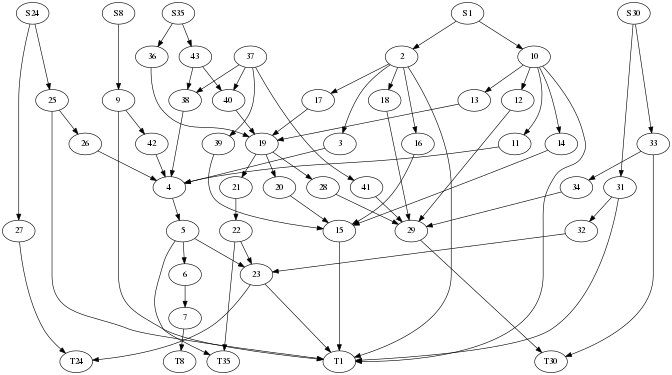
digraph world { size="7,7"; {rank=same; S8 S24 S1 S35 S30;} {rank=same; T8 T24 T1 T35 T30;} {rank=same; 43 37 36 10 2;} {rank=same; 25 9 38 40 13 17 12 18;} {rank=same; 26 42 11 3 33 19 39 14 16;} {rank=same; 4 31 34 21 41 28 20;} {rank=same; 27 5 22 32 29 15;} {rank=same; 6 23;} {rank=same; 7;} S8 -> 9; S24 -> 25; S24 -> 27; S1 -> 2; S1 -> 10; S35 -> 43; S35 -> 36; S30 -> 31; S30 -> 33; 9 -> 42; 9 -> T1; 25 -> T1; 25 -> 26; 27 -> T24; 2 -> {3 ; 16 ; 17 ; T1 ; 18} 10 -> { 11 ; 14 ; T1 ; 13; 12;} 31 -> T1; 31 -> 32; 33 -> T30; 33 -> 34; 42 -> 4; 26 -> 4; 3 -> 4; 16 -> 15; 17 -> 19; 18 -> 29; 11 -> 4; 14 -> 15; 37 -> {39 ; 41 ; 38 ; 40;} 13 -> 19; 12 -> 29; 43 -> 38; 43 -> 40; 36 -> 19; 32 -> 23; 34 -> 29; 39 -> 15; 41 -> 29; 38 -> 4; 40 -> 19; 4 -> 5; 19 -> {21 ; 20 ; 28;} 5 -> {6 ; T35 ; 23;} 21 -> 22; 20 -> 15; 28 -> 29; 6 -> 7; 15 -> T1; 22 -> T35; 22 -> 23; 29 -> T30; 7 -> T8; 23 -> T24; 23 -> T1; } |
digraph G { size="8,6"; ratio=fill; node[fontsize=24]; a0 -> a1; a0 -> a2; a1 -> a3; a2 -> a3; a2 -> a4; a3 -> a5; a4 -> a5; subgraph "cluster0" { label="scb_0"; a0; a3; a1; a2; } subgraph "cluster1" { label="scb_1"; a4; } subgraph "cluster2" { label="scb_2"; a5; } } |
[[https://brantou.github.io/images/ob-dot-intro/graph-with-scb.png]]
Render by hexo-renderer-org with Emacs 25.3.2 (Org mode 8.2.10)